Probability Calculator
Table of contents
How to find the probability of events? – probability definitionHow to use the probability calculator?Conditional probabilityConditional probability formulaProbability distribution and cumulative distribution functionTheoretical vs experimental probabilityProbability and statisticsStatistics within a large group of people – probability samplingPractical application of probability theoryFAQsWith the probability calculator, you can investigate the relationships of likelihood between two separate events. For example, if the chance of A happening is 50%, and the same for B, what are the chances of both happening, only one happening, at least one happening, or neither happening, and so on.
Our probability calculator gives you six scenarios, plus 6 more when you enter in how many times the "die is cast", so to speak. As long as you know how to find the probability of individual events, it will save you a lot of time.
Reading on below, you'll:
- Discover how to use the probability calculator properly;
- Check how to find the probability of single events;
- Read about multiple examples of probability usage, including conditional probability formulas;
- Study the difference between a theoretical and empirical probability; and
- Increase your knowledge about the relationship between probability and statistics.
Did you come here specifically to check your odds of winning a bet or hitting the jackpot? Our odds calculator and lottery calculator will assist you!
How to find the probability of events? – probability definition
The basic definition of probability is the ratio of all favorable results to the number of all possible outcomes.
Allowed values of a single probability vary from 0 to 1, so it's also convenient to write probabilities as percentages. The probability of a single event can be expressed as such:
- The probability of
A:P(A), - The probability of
B:P(B), - The probability of
+:P(+), - The probability of
♥:P(♥), etc.
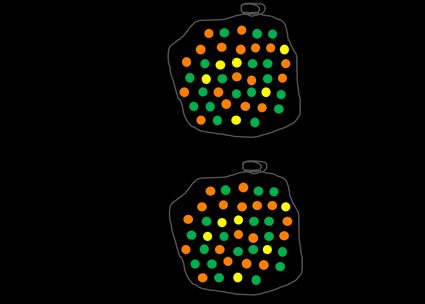
Let's take a look at an example with multi-colored balls. We have a bag filled with orange, green, and yellow balls. Our event A is picking a random ball out of the bag. We can define Ω as a complete set of balls. The probability of event Ω, which means picking any ball, is naturally 1. In fact, a sum of all possible events in a given set is always equal to 1.
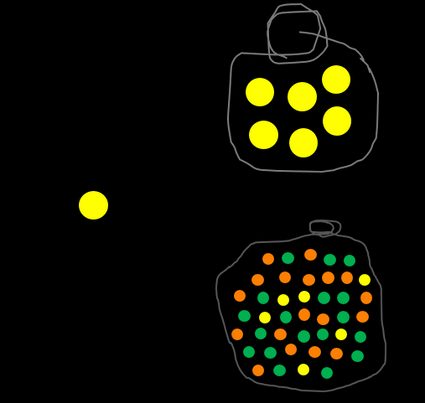
Now let's look at something more challenging – what's the likelihood of picking an orange ball? To answer this question, you have to find the number of all orange marbles and divide it by the number of all balls in the bag. You can do it for any color, e.g., yellow, and you'll undoubtedly notice that the more balls in a particular color, the higher the probability of picking it out of the bag if the process is totally random.
Check out our probability calculator 3 events and conditional probability calculator for determining the chances of multiple events.
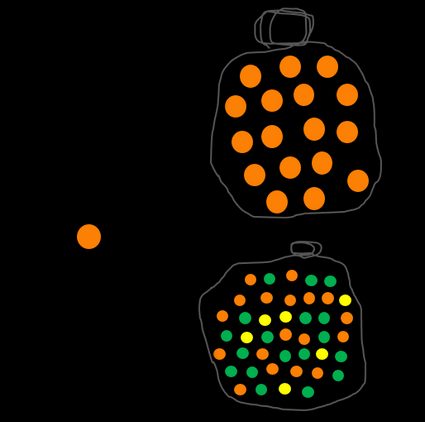
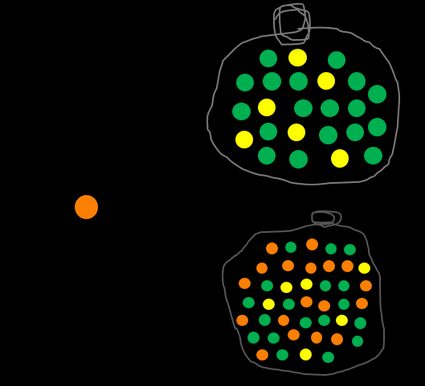
We can define a complementary event, written as Ā or A', which means not A. In our example, the probability of picking out NOT an orange ball is evaluated as a number of all non-orange ones divided by all marbles. The sum P(A) + P(Ā) is always 1 because there is no other option like half of a ball or a semi-orange one.
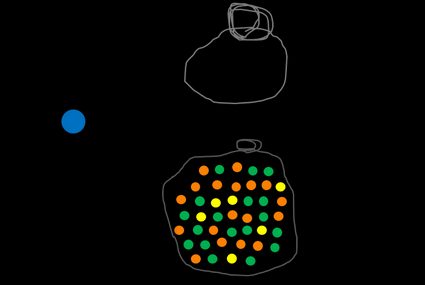
Now, try to find the probability of getting a blue ball. No matter how hard you try, you will fail because there is not even one in the bag, so the result is equal to 0.
We use intuitive calculations of probability all the time. Knowing how to quantify likelihood is essential for statistical analysis. It allows you to measure this otherwise nebulous concept called "probability". Furthermore, given a discrete dataset, the relative frequency for each value is synonymous with the probability of their occurrence.
Are you looking for something slightly different? Take a look at our post-test probability calculator. 🎲
How to use the probability calculator?
To make the most of our calculator, you'll need to take the following steps:
1. Define the problem you want to solve.
Your problem needs to be condensed into two independent events.
2. Find the probability of each event.
Now, when you know how to estimate the likelihood of a single event, you only need to perform the task and obtain all of the necessary values.
3. Type the percentage probability of each event in the corresponding fields.
Once they're in, the probability calculator will immediately populate with the exact likelihood of 6 different scenarios:
- Both events will happen;
- At least one of the events will happen;
- Exactly one of the events will happen;
- Neither of the events will happen;
- Only the first event won't happen; and
- Only the second event won't happen
You can also choose to see all of the above. Additionally, the calculator can also show the probability of six more scenarios, given a certain number of trials:
- A always occurring;
- A never occurring;
- A occurring at least once;
- B always occurring;
- B never occurring; and
- B occurring at least once.
You can change the number of trials and any other field in the calculator, and the other fields will automatically adjust themselves. This feature saves a ton of time if you want to find out, for example, what the probability of event B would need to become in order to make the likelihood of both occurring 50%.
If the set of possible choices is extremely large and only a few outcomes are successful, the resulting probability is tiny, like P(A) = 0.0001. It's convenient to use scientific notation in order not to mix up the number of zeros.
Conditional probability
One of the most crucial considerations in the world of probabilities is whether the events are dependent or not. Two events are independent if the occurrence of the first one doesn't affect the likelihood of the occurrence of the second one. For example, if we roll a perfectly balanced standard cubic die, the possibility of getting a two ⚁ is equal to 1/6 (the same as getting a four ⚃ or any other number).
Let's say you have two dice rolls, and you get a five ⚄ in the first one. If you ask yourself what's the probability of getting a two ⚁ in the second turn, the answer is 1/6 once again because of the independence of events.
The way of thinking, as well as calculations, change if one of the events interrupts the whole system. This time we're talking about conditional probability.
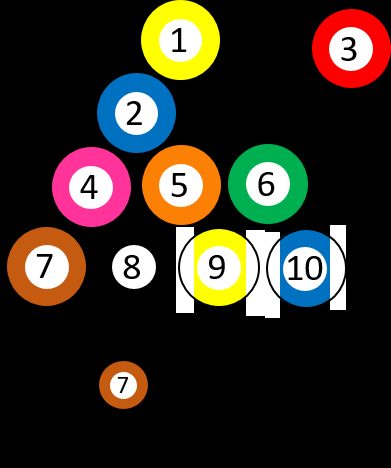
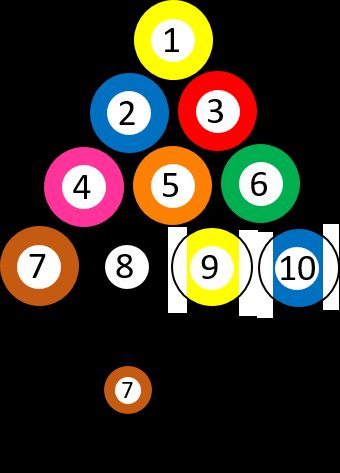
Let's say we have 10 different numbered billiard balls, from ➀ to ➉. You choose a random ball, so the probability of getting the ➆ is precisely 1/10. Suppose you picked the three ➂ and removed it from the game. Then you ask yourself, once again, what is the chance of getting the seven ➆. The situation changed because there is one ball with ➆ out of nine possibilities, which means that the probability is 1/9 now. In other words, the question can be asked: "What's the probability of picking ➆, IF the first ball was ➂?"
Let's look at another example: imagine that you are going to sit an exam in statistics. You know from your older colleagues that it's challenging, and the probability that you pass in the first term is 0.5 (18 out of 36 students passed last year). Then let's ask yourself a question: "What's the probability of passing IF you've already studied the topic?" 20 people admitted to reviewing their notes at least once before the exam, and 16 out of those succeeded, which means that the answer to the last question is 0.8. This result indicates that this additional condition really matters if we want to find whether studying changes anything or not.
If you still don't feel the concept of conditional probability, let's try with another example: you have to drive from city X to city Y by car. The distance between them is about 150 miles. On the full tank, you can usually go up to 400 miles. If you don't know the fuel level, you can estimate the likelihood of successfully reaching the destination without refueling. And what if somebody has already filled the tank? Now you're almost sure that you can make it unless other issues prevent it.
Conditional probability formula
The formal expression of conditional probability, which can be denoted as P(A|B), P(A/B) or PB(A), can be calculated as:
P(A|B) = P(A∩B) / P(B),
where P(B) is the probability of an event B, and P(A∩B) is the joint of both events. On the other hand, we can estimate the intersection of two events if we know one of the conditional probabilities:
P(A∩B) = P(A|B) * P(B)orP(A∩B) = P(B|A) * P(A).
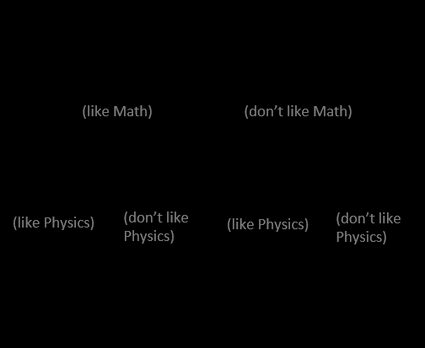
It's better to understand the concept of conditional probability formula with tree diagrams. We ask students in a class if they like Math and Physics. An event M denotes the percentage that enjoys Math, and P the same for Physics:
There is a famous theorem that connects conditional probabilities of two events. It's named Bayes' theorem, and the formula is as follows:
P(A|B) = P(B|A) * P(A) / P(B)
You can ask a question: "What is the probability of A given B if I know the likelihood of B given A?". This theorem sometimes provides surprising and unintuitive results. The most commonly described examples are drug testing and illness detection, which has a lot in common with the relative risk of disease in the population. Let's stick to the second one. In a group of 1000 people, 10 of them have a rare disease. Everybody had a test, which shows the actual result in 95% of cases. So now we want to find the probability of a person being ill if their test result is positive.
Without thinking, you may predict, by intuition, that the result should be around 90%, right? Let's make some calculations and estimate the correct answer.
- We will use a notation:
H– healthy,I– ill,+– test positive,-– test negative. - Rewrite information from the text above in a way of probabilities:
P(H) = 0.99,P(I) = 0.01,P(+|I) = 0.95,P(-|I) = 0.05,P(+|H) = 0.05,P(-|H) = 0.95. - Work out the total probability of a test to be positive:
P(+) = P(+|I) * P(I) + P(+|H) * P(H) = 0.95 * 0.01 + 0.05 * 0.99 = 0.059. - Use the Bayes' theorem to find the conditional probability
P(I|+) = P(+|I) * P(I) / P(+) = 0.95 * 0.01 / 0.059 = 0.161.
Hmm... it isn't that high, is it? It turns out that this kind of paradox appears if there is a significant imbalance between the number of healthy and ill people, or in general, between two distinct groups. If the result is positive, it's always worth repeating the test to make an appropriate diagnosis.
Probability distribution and cumulative distribution function
We can distinguish between two kinds of probability distributions, depending on whether the random variables are discrete or continuous.
-
A discrete probability distribution describes the likelihood of the occurrence of countable, distinct events. One of the examples is binomial probability, which takes into account the probability of some kind of success in multiple turns, e.g., while tossing a coin. In contrast, in the Pascal distribution (also known as negative binomial) the fixed number of successes is given, and you want to estimate the total number of trials.
The Poisson distribution is another discrete probability distribution and is actually a particular case of binomial one, which you can calculate with our Poisson distribution calculator. The probability mass function can be interpreted as another definition of discrete probability distribution – it assigns a given value to any separate number. The geometric distribution is an excellent example of using the probability mass function.
-
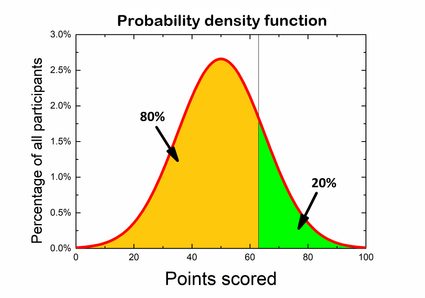
A continuous probability distribution holds information about uncountable events. It's impossible to predict the likelihood of a single event (like in a discrete one), but rather that we can find the event in some range of variables. The normal distribution is one of the best-known continuous distribution. It describes a bunch of properties within any population, e.g., the height of adult people or the IQ dissemination. The function that describes the probability of seeing a result from a given range of values is called the probability density function.
If you are more advanced in probability theory and calculations, you definitely have to deal with SMp(x) distribution, which takes into account the combination of several discrete and continuous probability functions.
For each probability distribution, we can construct the cumulative distribution function (CDF). It tells you what the probability is that some variable will take the value less than or equal to a given number.
Let's say you participate in a general knowledge quiz. The competition consists of 100 questions, and you earn 1 point for a correct answer, whereas for the wrong one, there are no points. Many people have already finished, and out of the results, we can obtain a probability distribution. Rules state that only 20% best participants receive awards, so you wonder how well you should score to be one of the winners. If you look at the graph, you can divide it so that 80% of the area below is on the left side and 20% of the results are on the right of the desired score. What you are actually looking for is a left-tailed p-value.
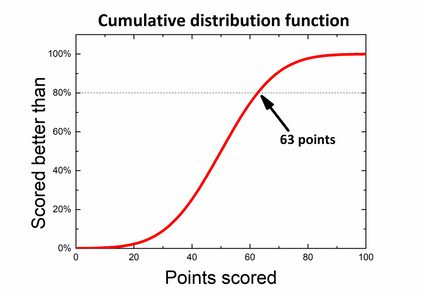
However, there is also another way to find it if we use a cumulative distribution function – just find the value 80% on the axis of abscissa and the corresponding number of points without calculating anything!
Theoretical vs experimental probability
Almost every example described above takes into account the theoretical probability. So a question arises: what's the difference between theoretical and experimental (also known as empirical) probability? The formal definition of theoretical probability is the ratio between the number of favorable outcomes to the number of every possible outcome. It relies on the given information, logical reasoning and tells us what we should expect from an experiment.
Just look at bags with colorful balls once again. There are 42 marbles in total, and 18 of them are orange. The game consists of picking a random ball from the bag and putting it back, so there are always 42 balls inside. Applying the probability definition, we can quickly estimate it as 18/42, or simplifying the fraction, 3/7. It means that if we pick 14 balls, there should be 6 orange ones.
On the other hand, the experimental probability tells us precisely what happened when we perform an experiment instead of what should happen. It is based on the ratio of the number of successful and the number of all trials. Let's stick with the same example – pick a random marble from the bag and repeat the procedure 13 more times. Suppose you get 8 orange balls in 14 trials. This result means that the empirical probability is 8/14 or 4/7.
As you can see, your outcome differs from the theoretical one. It's nothing strange because when you try to reiterate this game over and over, sometimes, you will pick more, and sometimes you will get less, and sometimes you will pick exactly the number predicted theoretically. If you sum up all results, you should notice that the overall probability gets closer and closer to the theoretical probability. If not, then we can suspect that picking a ball from the bag isn't entirely random, e.g., the balls of different colors have unequal sizes, so you can distinguish them without having to look.
Probability and statistics
Both statistics and probability are the branches of mathematics and deal with the relationship of the occurrence of events. However, everyone should be aware of the differences which make them two distinct areas.
-
Probability is generally a theoretical field of math, and it investigates the consequences of mathematical definitions and theorems. In contrast, statistics is usually a practical application of mathematics in everyday situations and tries to attribute sense and understanding of the observations in the real world.
-
Probability predicts the possibility of events to happen, whereas statistics is basically analyzing the frequency of the occurrence of past ones and creates a model based on the acquired knowledge.
-
Imagine a probabilist playing a card game, which relies on choosing a random card from the whole deck, knowing that only spades win with predefined odds ratio. Assuming that the deck is complete and the choice is entirely random and equitable, they deduce that the probability is equal to
¼and can make a bet. -
A statistician is going to observe the game for a while first to check if, in fact, the game is fair. After verifying (with acceptable approximation) that the game is worth playing, then he will ask the probabilist what he should do to win the most.
Statistics within a large group of people – probability sampling
You've undoubtedly seen some election preference polls, and you may have wondered how they may be quite so precise in comparison to final scores, even if the number of people asked is way lower than the total population – this is the time when probability sampling takes place.
The underlying assumption, which is the basic idea of sampling, is that the volunteers are chosen randomly with a previously defined probability. We can distinguish between multiple kinds of sampling methods:
- Simple random sampling
- Cluster random sampling
- Systematic sampling
- Probability-proportional-to-size sampling
- Stratified random sampling
- Minimax sampling
- Accidental sampling
- Quota sampling
- Voluntary sampling
- Panel sampling
- Snowball sampling
- Line-intercept sampling
- Theoretical sampling
Each of these methods has its advantages and drawbacks, but most of them are satisfactory. Significant benefits of probability sampling are time-saving, and cost-effectiveness since a limited number of people needs to be surveyed. The simplicity of this procedure doesn't require any expertise and can be performed without any thorough preparation.
Practical application of probability theory
As you could have already realized, there are a lot of areas where the theory of probability is applicable. Most of them are games with a high random factor, like rolling dice or picking one colored ball out of 10 different colors, or many card games. Lotteries and gambling are the kinds of games that extensively use the concept of probability and the general lack of knowledge about it. Of course, somebody wins from time to time, but the likelihood that the person will be you is extremely small.
Probability theory is also used in many different types of problems. Especially when talking about investments, it is also worth considering the risk to choose the most appropriate option.
Our White Christmas calculator uses historical data and probability knowledge to predict the occurrence of snow cover for many cities during Christmas.
How do I calculate the probability of A and B?
If A and B are independent events, then you can multiply their probabilities together to get the probability of both A and B happening. For example, if the probability of A is 20% (0.2) and the probability of B is 30% (0.3), the probability of both happening is 0.2 × 0.3 = 0.06 = 6%.
How do I calculate conditional probability?
To compute the conditional probability of A under B:
- Determine the probability of B, i.e., P(B).
- Determine the probability of A and B, i.e., P(A∩B).
- Divide the result from Step 2 by that of Step 1.
- That's it! The formula reads: P(A|B) = P(A∩B) / P(B).
What's the probability of rolling 2 sixes?
If you are using fair dice, the probability of rolling two sixes will be 1/6 × 1/6 = 1/36 = 0.027 = 2.7%. That means it takes 36 dice rolls to expect rolling 2 sixes at least once, though there's no guarantee when it comes to probability.
How do I convert odds to percentage?
Convert the odds to a decimal number, then multiply by 100. For example, if the odds are 1 in 9, that's 1/9 = 0.1111 in decimal form. Then multiply by 100 to get 11.11%.